A few months ago I wrote a guest post on how to use Google Analytics. I decided I wanted to share it here for any of you who may have missed it. I have added a little more to it for those of you who might need a little extra help. If you have a blog, I encourage you to get Google Analytics. You may be wondering what is so great about it – well if you are trying to grow your blog you really ought to know what types of people you’re attracting and how they are finding your blog. If you know where the bulk of you traffic is referred from (like a link party) you want to continue the link-up there! If you know why they are coming you may want to post similar things. (By the way – if you have a shop you can use Google Analytics to track the traffic there too!) You also might be wondering why I am qualified to write this post? You see – I have been using Google Analytics since my early ETSY days in 2007 (before they tracked things for you!). First off – here is how you ‘install’ in on your blog (These directions are for blogger blogs – sorry WordPress friends). You go to www.google.com/analyitics and sign up!
Then it takes you to a page like this… fill in the blanks. I helped you by telling you exactly what to put. There is a user agreement below this part, once you agree you can create the account. Now it will take you to another page and give you a number that looks something like UA – 0000000000 – copy and paste this number. In another tab go to your blogger dashboard. (For this part I am explaining it under the impression that you are using the updated version of the dashboard.) Go to Settings and then choose ‘Other’. At the very bottom of the page you will see a spot to enter your Google Analytics ID. Just paste it in the box and save. Give it 24-48 hours to start tracking on your newly created Google Analytics page!
  Okay – so now you all have Google Analytics installed on your blog… right? Good! I know this might be a little drawn out, but the info is totally worth it!
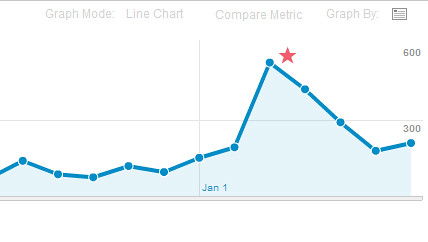
 When you first sign into G.A. (this is how I will refer to it for the rest of the post) you are going to be taken to the Standard Reporting page. I like to then click on ‘HOME’ which is labeled #1. My favorite chart to check is the daily visits chart – labeled #3. This shows a graph of how many visitors you have each day. See that spike? That is what I like to see!
  Below the line graphs you will see a pie chart (below) and some more stats. Sure they just look like numbers and mumbo jumbo – but they are interesting. The pie chart shows how people are coming to your site.
- Referrals mean another website sent them (the blue)
- Organic means that a visitor used a search engine and found your page through the results and ACTUALLY visited your site (the green)
- Direct means they typed in your URL in the address bar and pressed enter (the orange)
- Feed means that the person was reading your blog through a feed (or they are an email subscriber to your blog) and then clicked on a link that took them to your actual page (the yellow)
- Email means that they came through an email campaign – this DOES NOT include an email sent to someone who subscribes to your feeds by email (the aqua/blue)
Then you can see time on site by country. Most of us are going to have the United Sates on the top – but I always find it fascinating to see where else visitors are coming from. Spain?! Italy?! Germany?! 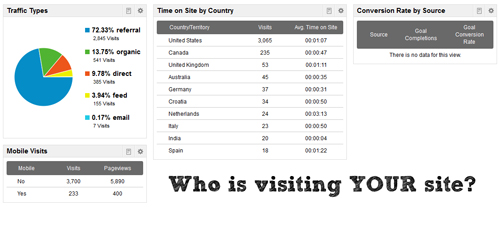 Okay – so what am I truly interested in? Traffic! How are people finding my blog? From my pie chart I know most of my visits are from referrals – so who is referring? Go back to ‘Standard Reporting’ across the top bar. Then on the left sidebar click Traffic Sources>Sources>All Traffic (star #1). It will take you to the page you see below. By default this chart will show you all of the traffic for the past 30 days. The star labeled ‘2’ tells me how many visits I have had in those 30 days. If I want to know the traffic my blog has had in the past four months I just change it (star labeled #3).
 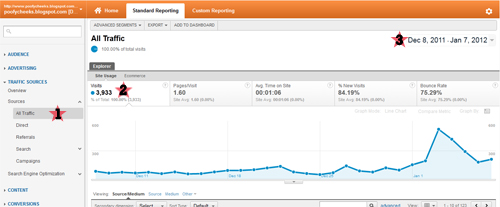 So how do I know how much traffic I received each day you ask? Just hover over the dots on the graph and it will show you the exact number of visits.
 So now you know your numbers – but we still don’t know where they are COMING FROM. I’m getting there! Below ‘All Traffic’ on the left sidebar click on ‘Referrals’. It will take you to a page that looks like the one below. This looks similar to the ‘All Traffic’ page, except for it is no longer showing your direct, organic, feed, or email traffic. When you look at the numbers on your line chart they won’t be as big. However, below the line chart is a list of sites which are sending referrals to your blog. I highlighted the most important area in red.
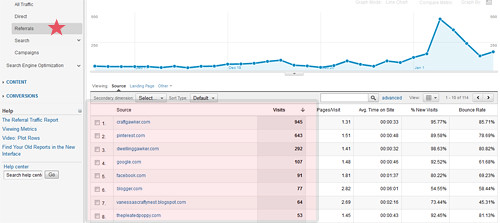 In order to see things a little better I zoomed into that red highlighted area… Now we can see who my top 8 referring sites were for the past 30 days. Awesome huh?!? You may notice that the referring sites on YOUR list are blogs you often participate in link parties at, one that sponsors you, or you may just have no idea. Again – that’s what we like to see!
 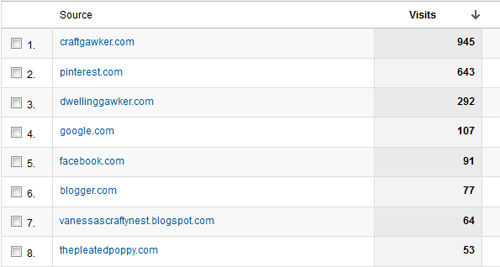 So that is the lesson for the day! Get Google Analytics friends!! There is still so much I did not cover, but you can’t hurt anything – just click around and you will find some pretty cool stuff. Like a map of your visitors! Just hover over a country to see how many visitors you have had.
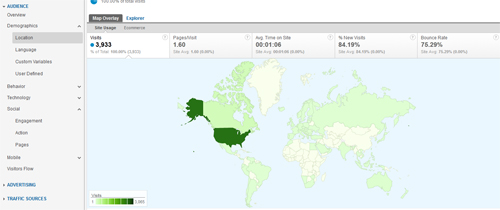 Please let me know if you have any questions!! You can’t really hurt anything so just explore!


Bostonista
Tuesday 29th of April 2014
@Lesley I have the same problem! I have so many places that gather stats and they are all so different. How do I know what is accurate and what isn't?
xoKarawww.thebostonista.com
Lesley
Sunday 25th of August 2013
I wonder if you can help me out here... My Google Analytics are WAY lower than my Blogger stats... I feel like my GA stats must be wrong. Any idea what might be going on?
Lesley / bytheporchlight.com